Interactive Map Statistics
The data that proves your interactive map’s value
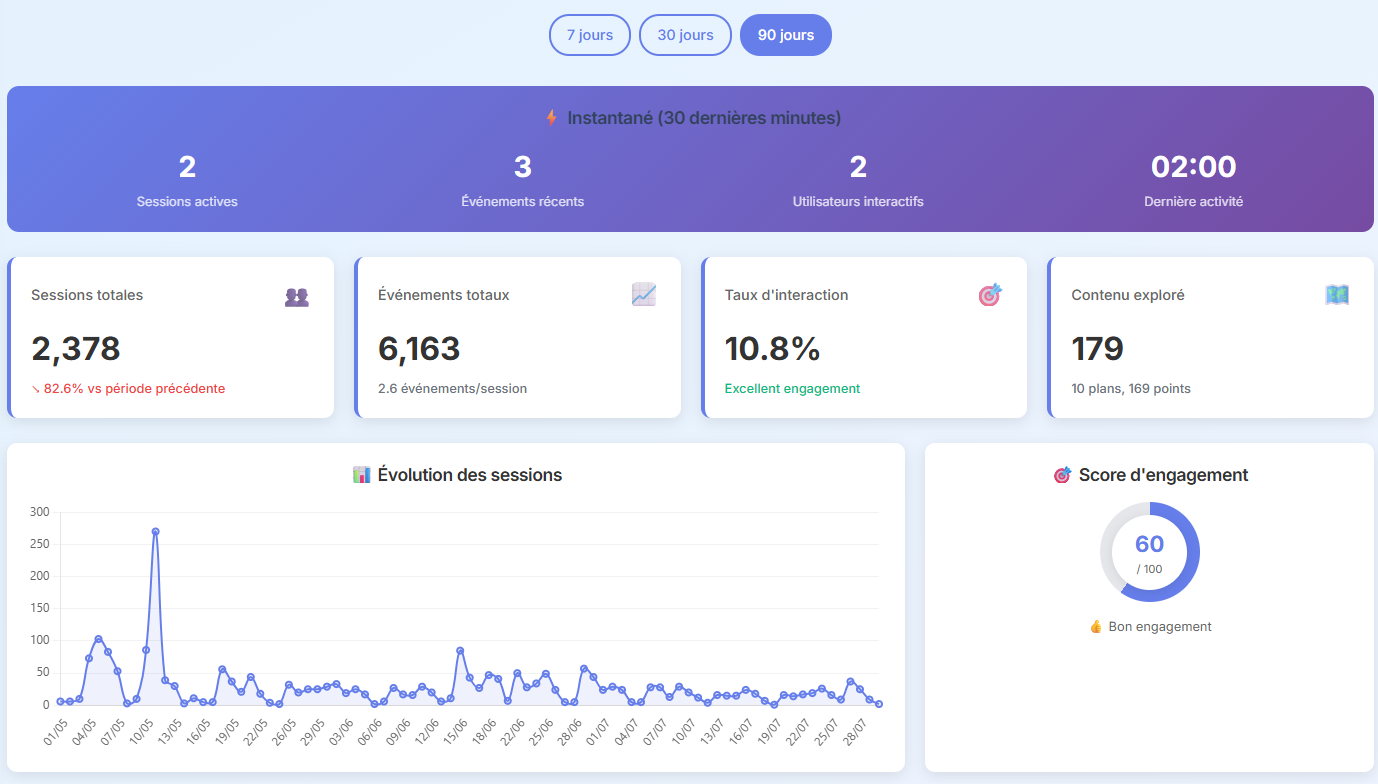
A well-designed interactive map earns its keep every day — but without interactive map statistics to back it up, that value stays invisible to whoever decides the budget. Every ownMap map comes with its own real-time usage dashboard, no extra setup required. Here’s why it’s not just a nice-to-have, but a genuine management tool.
Why measure?
Interactive map statistics : six reasons to track them
Justify the budget, every year
Sessions, routes calculated, searches performed : concrete metrics to show your management or local authority at renewal time.
Spot what isn’t working yet
A place that’s never searched for, a route abandoned midway : statistics reveal friction invisible to the naked eye and guide your improvement priorities.
Measure the impact of your key events
Back-to-school, open house, trade show : compare footfall before and after an event or a communication campaign.
Prove real accessibility
Anticipate flow instead of reacting to it
Identifying peak hours and high-traffic zones helps you right-size staffing and signage, backed by real data.
Showcase your digital transformation
A live, constantly updated dashboard is tangible proof of modernization to show your management, your oversight bodies, or in your activity reports.
In the field
A concrete example of interactive map statistics : URCA’s campus
This kind of volume, visible directly in the dashboard, turns a map that merely “exists” into a service whose real usage is measured — and therefore defensible.
students guided every day
Buildings on URCA’s campus
Data sovereignty
And where does your statistics data go ?
Just like the rest of the platform, your statistics stay hosted in France, under French law, with GDPR compliance built in by design — often a deciding factor for public institutions.